








A framing shop sells custom orders for $75 each. On a busy Saturday the till looks healthy, but the owner still has rent, insurance and supplies to cover. The monthly break-even point answers a useful question before the month ends. How many orders at this price and cost would cover the shop’s operating costs?
A monthly break-even point turns a general sales goal into a figure you can compare with actual orders, staffing capacity and expected demand. This example follows one standard framing package. Use the same approach for a service, a simple product line or a stable mix you can explain. The dollar amounts and order volumes are illustrative.
Table of contents
- Gather the three inputs
- Calculate your monthly break-even point
- Test price, cost and capacity
- Put the target beside the cash forecast
- Review the result against actual orders
- Frequently asked questions
- Conclusion
Gather the three inputs
Start with one month and one unit you can count. The shop uses completed standard frame orders and a representative month. A cleaning company might count completed visits. If a business sells projects that take several months, it should decide which comparable units it can reliably measure before adopting an order-based model. The monthly break-even point only helps when the costs and volume refer to the same activity and period.
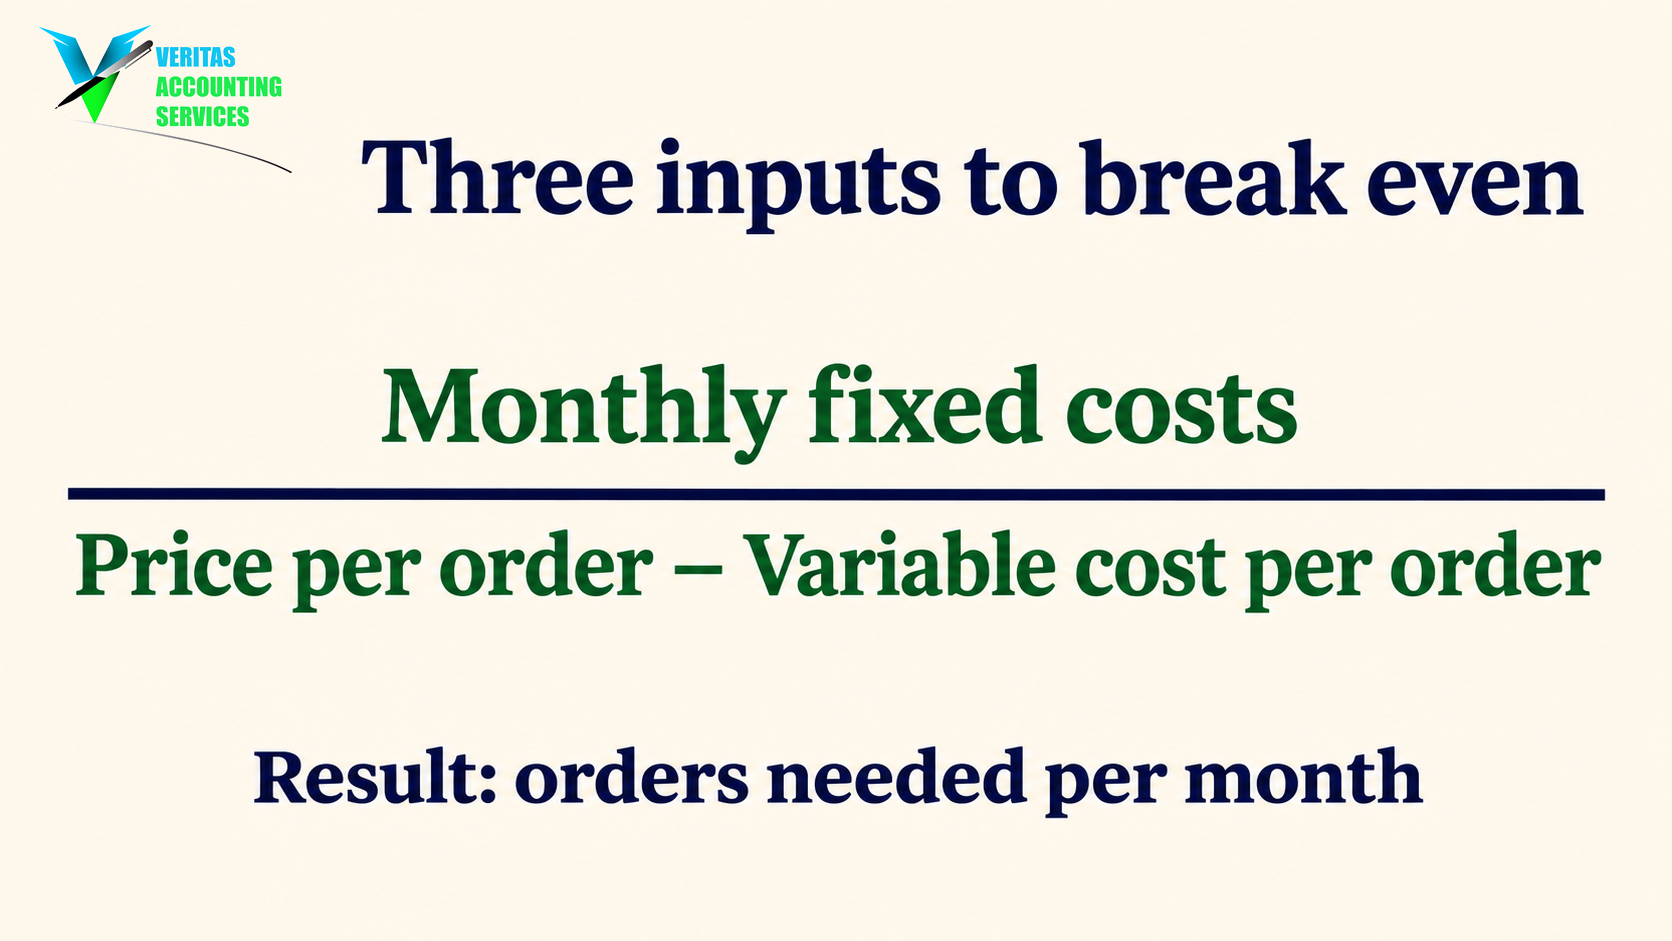
The U.S. Small Business Administration’s break-even guide starts with fixed costs, selling price and variable cost per unit. Use your own recent records to estimate them. Label assumptions beside the numbers so that a change in one input can be traced to a supplier quote, an actual sales report or a decision someone made.
Identify the costs you expect to carry each month
List expenses you expect to incur over the range of orders you are modeling, even in a quiet month. For the example, rent, insurance and other operating overhead total $3,000 a month. A cost can be fixed for a decision even though the supplier raises it later. Write down when the next renewal or rent increase takes effect. It may belong in next month’s model instead of this month’s.
Check your monthly profit and loss report against invoices for items that arrive irregularly. For internal planning, you might spread an annual insurance cost over the months it covers and put the full payment in the month it leaves the bank on the cash forecast. Ask your bookkeeper how the expense is treated in the actual reports. Documenting the planning choice helps explain differences between the monthly break-even point and cash needed on particular dates.
Estimate what one additional order costs
The shop includes materials and other costs it expects to incur for each standard order. Its working estimate is $45. To build your own estimate, pick a few comparable jobs. List the materials used, piece-rate or other labor that rises with volume, packaging, and selling fees that change with the order. Use a representative cost and note exceptions such as rush freight or a special finish.
Some bills combine a base charge and a charge that rises with activity. A platform fee may have a flat monthly subscription and a fee per order. Put the predictable base with monthly overhead and the per-order amount in the order estimate. Check that the full bill appears once across the two amounts. The Veritas expense classification guide covers how to organize the underlying records. For this model, the useful distinction is how each cost behaves when volume changes.
Use the price you expect to realize
In the example, the shop expects to keep $75 of revenue per order before the $45 of variable costs. Check actual selling prices against the advertised price. Discounts, returns and credits can move the amount the business ultimately earns. If a payment processor subtracts a fee from the bank deposit, use consistent inputs so the fee is accounted for once. For example, starting with the sale price and putting the fee among variable costs keeps the treatment visible.
If you intend to offer a promotion for only part of the month, run a regular-price and discounted-price case first. Then estimate the number of orders at each price and combine the total amount those orders contribute. This makes the monthly break-even point easier to explain than a single average price with no record of how you got there.
Calculate your monthly break-even point
Subtract variable cost per order from selling price per order. In the shop’s example, $75 less $45 leaves $30 per completed order to cover fixed costs. Accountants call this the contribution per unit. Divide $3,000 in monthly fixed costs by the $30 contribution. The shop needs 100 completed orders to cover the modeled costs. At that volume, it earns $7,500 of revenue and incurs $4,500 of variable costs and $3,000 of fixed costs.
| Completed orders | Revenue | Variable costs | Fixed costs | Modeled operating result |
|---|---|---|---|---|
| 80 | $6,000 | $3,600 | $3,000 | −$600 |
| 100 | $7,500 | $4,500 | $3,000 | $0 |
| 120 | $9,000 | $5,400 | $3,000 | $600 |
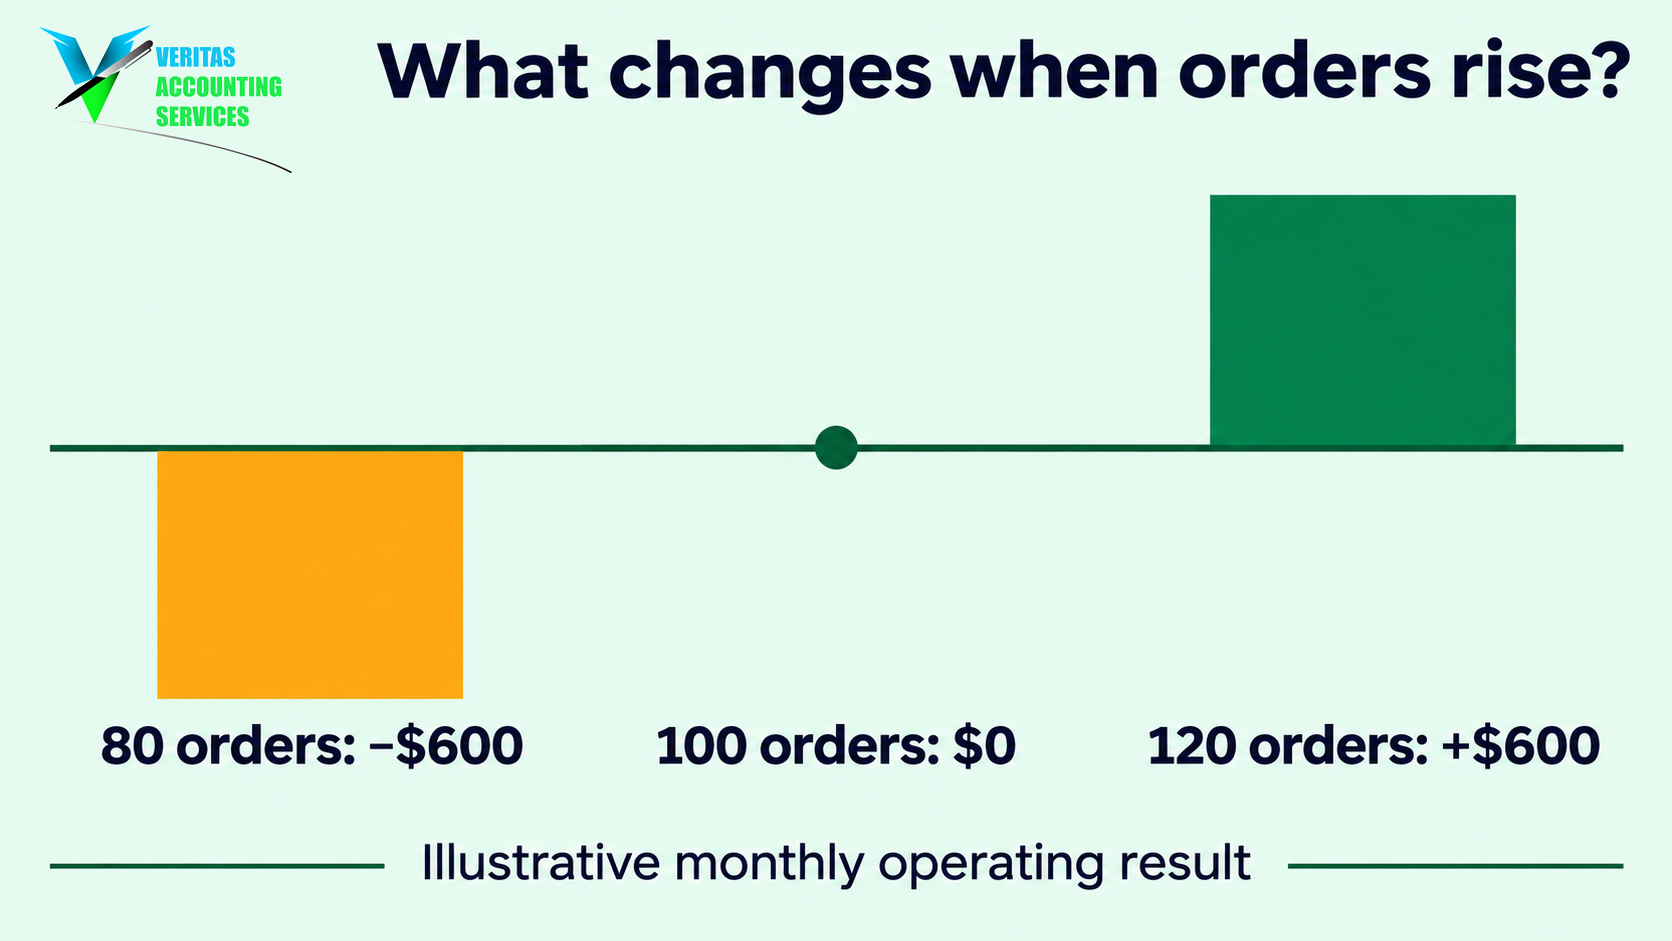
Read the table across a row when testing the monthly break-even point. At 80 orders the $2,400 left after variable costs covers most of the overhead, with $600 still uncovered. At 120 orders the contribution rises to $3,600 and $600 remains after overhead. This relationship works in the example because the shop assumes the same price, variable cost and fixed costs over this order range. If the assumptions change at higher volumes, update the table before projecting further.
If your calculation gives 100.4 orders, round up to 101 if you only complete whole orders. If the amount left from each sale is zero or negative, adding volume under those assumptions cannot cover positive fixed costs. Recheck the price and cost inputs before setting a volume target. A monthly break-even point worksheet that produces a negative result in that situation needs an explanatory warning instead of a target.
For a second check on the monthly break-even point, the SBA break-even calculator can run the basic model with the same inputs. Keep your working figures with the calculation. A reviewer should be able to see the model’s scope without opening a separate budget or guessing which package the business sells.
Test price, cost and capacity
Suppose the framing shop is considering a $5 discount. At $70, an order contributes $25 if its variable cost stays at $45. With the same $3,000 fixed cost, the new monthly break-even point is 120 orders. A discount needs to bring in 20 additional orders just to reach the same zero operating result that 100 orders achieved at the regular price.
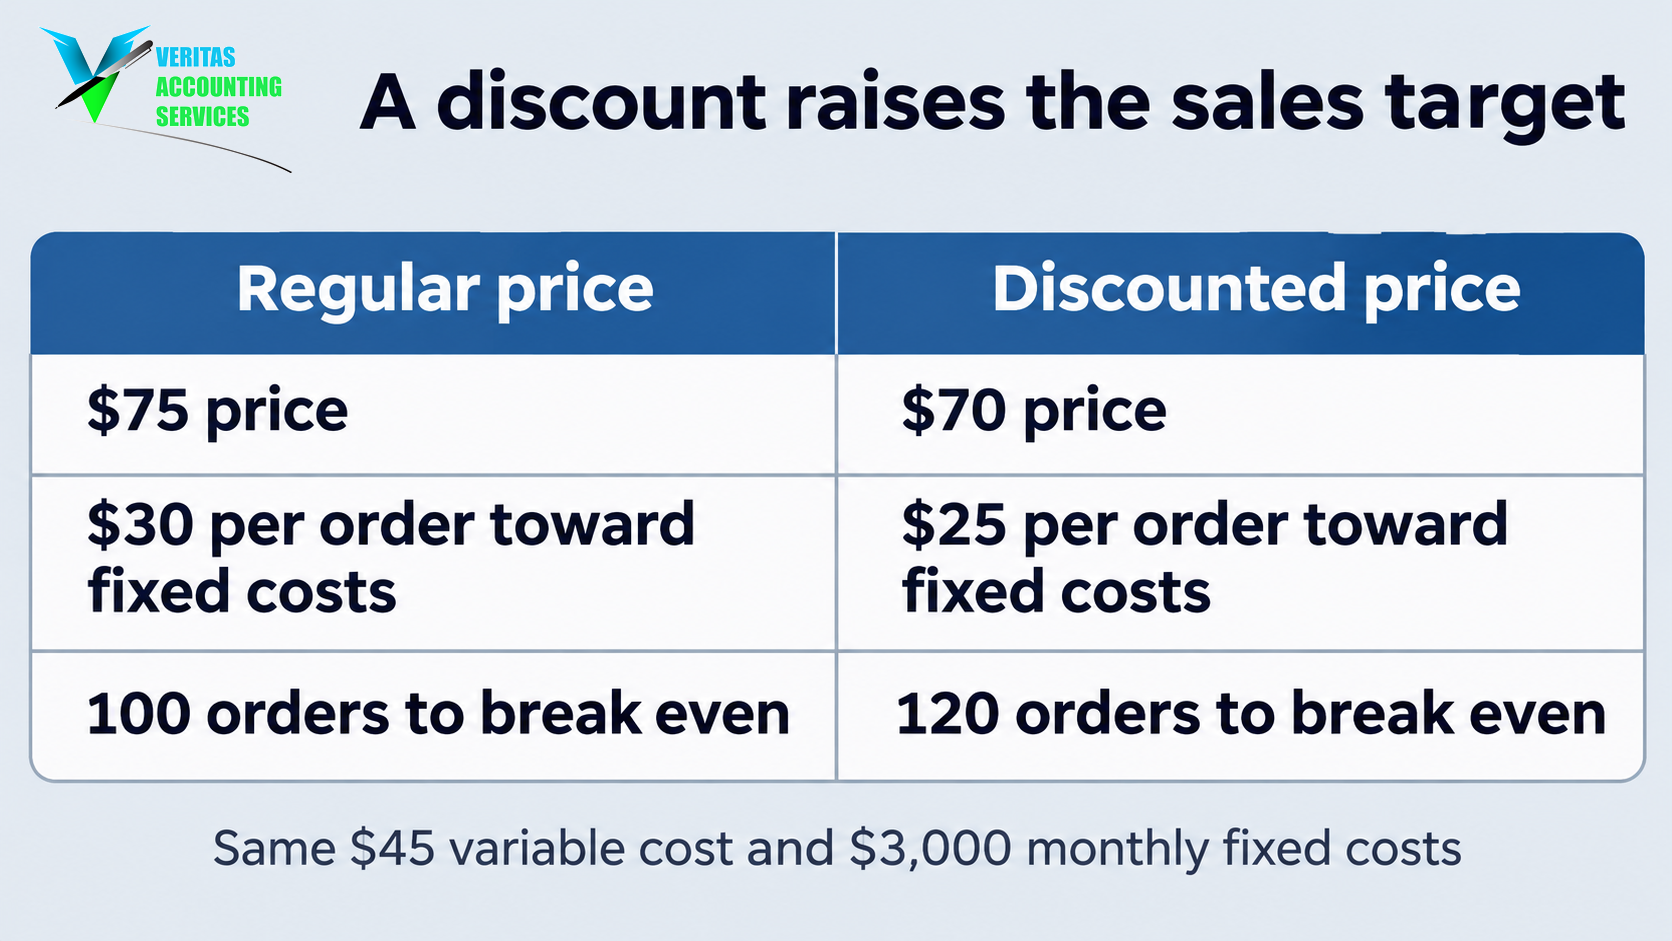
If the shop can reliably complete only 110 orders with its current team and equipment, the discounted scenario falls short even at capacity. At 110 discounted orders it generates $2,750 in contribution, leaving $250 of fixed costs uncovered. Compare the monthly break-even point with the orders you can complete and sell. Ask whether the extra work would displace full-price orders or require overtime. A discount that fills otherwise idle time can have a different outcome from a discount that replaces full-price sales.
Test a supplier increase separately. If the regular price stays $75 and the variable cost rises to $48, each order contributes $27. Dividing $3,000 by $27 gives about 111.1 orders, so 112 whole orders are needed to cover the modeled costs. Now the owner can decide which variable to investigate. Is the supplier change temporary? Can the shop source the same quality locally? Are customers willing to pay more for a faster turnaround? The model sets the size of the problem before anyone commits to a solution.
If volume requires a second employee or another workspace, draw the line where the extra overhead starts. Suppose the shop can complete 110 orders with current overhead but needs a recurring $600 monthly commitment to complete more. At the regular $30 contribution, the higher overhead calls for 120 orders. Check whether that order count is realistic in the expanded setup. A single monthly break-even point based on $3,000 can understate the target once the new commitment starts.
For multiple products, record each line’s unit contribution and typical share of sales. If premium orders contribute more than the standard package, a month with fewer premium sales can require more total orders even if every price holds. Try one scenario using the recent sales mix and another with a smaller premium share. Keep the mix assumption visible. Veritas’s discussion of marketplace fees and margins offers examples of charges worth investigating if you sell through a marketplace.
Put the target beside the cash forecast
Imagine that the shop completes the 100 orders needed at regular prices, but several customers have until next month to pay. Suppliers and rent may still be due this month. The monthly break-even point measures coverage of the costs in the model. A cash forecast uses collection and payment dates to estimate the funds available on a given day. Keep the two views side by side when deciding how many orders you can finance.
For a simple illustration, assume the shop has $2,000 cash at the start of the month, receives $5,000 from customers before month-end and pays all $7,500 of the modeled costs in cash during the month. It would be short by $500 if there were no other cash movements. The example is deliberately narrow. Any receipts from earlier sales, financing inflows or other payments would change the result. Check a few dates within the month too. A supplier payment early in the month can strain cash even if the ending balance looks comfortable.
Consider payments outside the operating model. A loan principal payment, for example, uses cash and needs a place in the cash plan. Owner withdrawals and a planned equipment purchase can also affect available funds. Label what your monthly break-even point includes and what you track separately. The SBA guide to managing business finances discusses financial statements and tracking money in and out. See also Veritas’s cash flow planning article.
Review the result against actual orders
Use the monthly break-even point at the start of a month and revisit it when the numbers change. The framing shop can compare the forecast with orders completed, realized selling price, material cost per order and actual overhead. When results differ, split the explanation into volume, price and cost. For example, selling fewer orders than planned is a different problem from selling enough orders at a lower realized price.
Keep one version of the model that preserves the original assumptions and one current version. If a higher materials bill changed the monthly break-even point, write down which order types it affects and when it starts. If a refund reduced realized sales, check whether that refund was unusual or whether a recurring issue needs an allowance in future forecasts. This record helps the owner avoid setting a new target every time an isolated cost appears.
A weekly check can put the target in context. If the shop has completed 40 orders halfway through the month and has only 30 scheduled for the rest, it can look at unconfirmed work, realistic capacity and expected cancellations before assuming it will reach 100. Discuss whether a realistic action can close the gap. If the extra orders require a discount or more labor, revisit the contribution calculation before committing to the volume plan.
Check whether your busiest order is worth the time
A workshop can run out of bench time before it runs out of customers. Suppose a custom order contributes $48 and takes two hours at the framing bench, while a standard order contributes $30 and takes one hour. With the bench fully booked and enough demand for either order, the standard order contributes $30 per bench hour versus $24 for the custom order. This comparison helps when choosing what to book into a full schedule. It depends on bench time being the actual constraint and the order estimates being comparable. Keep both assumptions next to the monthly break-even point. If demand is limited or another station becomes the bottleneck, redo the comparison.
Plan for a surplus
Set a separate goal for the surplus you need. If the shop wants $900 of modeled monthly operating profit and still earns $30 per order after variable costs, it needs $3,900 in total contribution, or 130 orders. Compare that with capacity and demand. The monthly break-even point gives the starting threshold and the profit target shows how much further the business needs to go. It may be easier to improve order contribution than to add 30 orders.
Frequently asked questions
Should I use the same monthly break-even point all year?
Use a new estimate when selling prices, costs, capacity or sales mix change materially. A seasonal business can prepare a slow-month and a busy-month version. Compare each monthly break-even point with a realistic plan for the period. Keep a dated copy when a new commitment changes the target so later reviews can see which assumption applied.
Can a service business calculate a monthly break-even point?
Yes. Pick a unit such as a completed service visit or a billable hour, then make sure its price and variable cost use that same unit. Estimate how many units the team can deliver after allowing time for travel, setup or administration as relevant. If jobs differ substantially, separate the main categories before combining them into a forecast.
How can I handle an expense that changes partway through the month?
Record the known date and the amount affected. If a price change applies only to orders after a specific date, estimate contribution from orders before and after it separately. For a fixed monthly cost that rises in the next billing period, make that period explicit. Keep the estimated monthly break-even point and the later scenario labeled so the two are easy to tell apart.
Is there a useful break-even figure in sales dollars?
For a single product with stable pricing, divide monthly fixed costs by the contribution as a share of selling price. The shop earns $30 contribution per $75 order, which is 40%. Dividing $3,000 by 40% gives $7,500 of sales. That agrees with 100 orders at $75 each. If different products earn different percentages, document the mix before applying a single percentage.
How do I handle a margin that varies order by order?
Start by dividing orders into a few comparable groups and calculate the contribution for each group. Then multiply each group’s expected orders by its contribution per order and add the results. Check whether that total covers monthly fixed costs. This gives you a way to model custom work when one unit figure would hide large price or materials differences.
Does the monthly break-even point tell me how much tax I will owe?
It estimates the volume needed to cover the costs included in your operating model. Tax calculations and payment dates depend on the applicable rules and the facts of the business. Keep those items visible in separate projections when they affect cash. Give your accountant the underlying assumptions and the reports the model uses.
Conclusion
Calculate the monthly break-even point using a consistent period, a realistic realized price and a variable cost tied to a unit you can count. Compare the result with your ability to sell and deliver that volume. Test a realistic change in price or cost and check the collection and payment dates before relying on the plan.
Begin with one product or service. Pull last month’s overhead, choose a typical order and estimate what it contributes after variable costs. Write down the monthly break-even point and the assumption that would most change it. That gives you a practical number to revisit when actual results come in.
GET IN TOUCH
Schedule a FREE Call
Connect on our Socials!